
Last updated on 2026-10-04
Dashboard
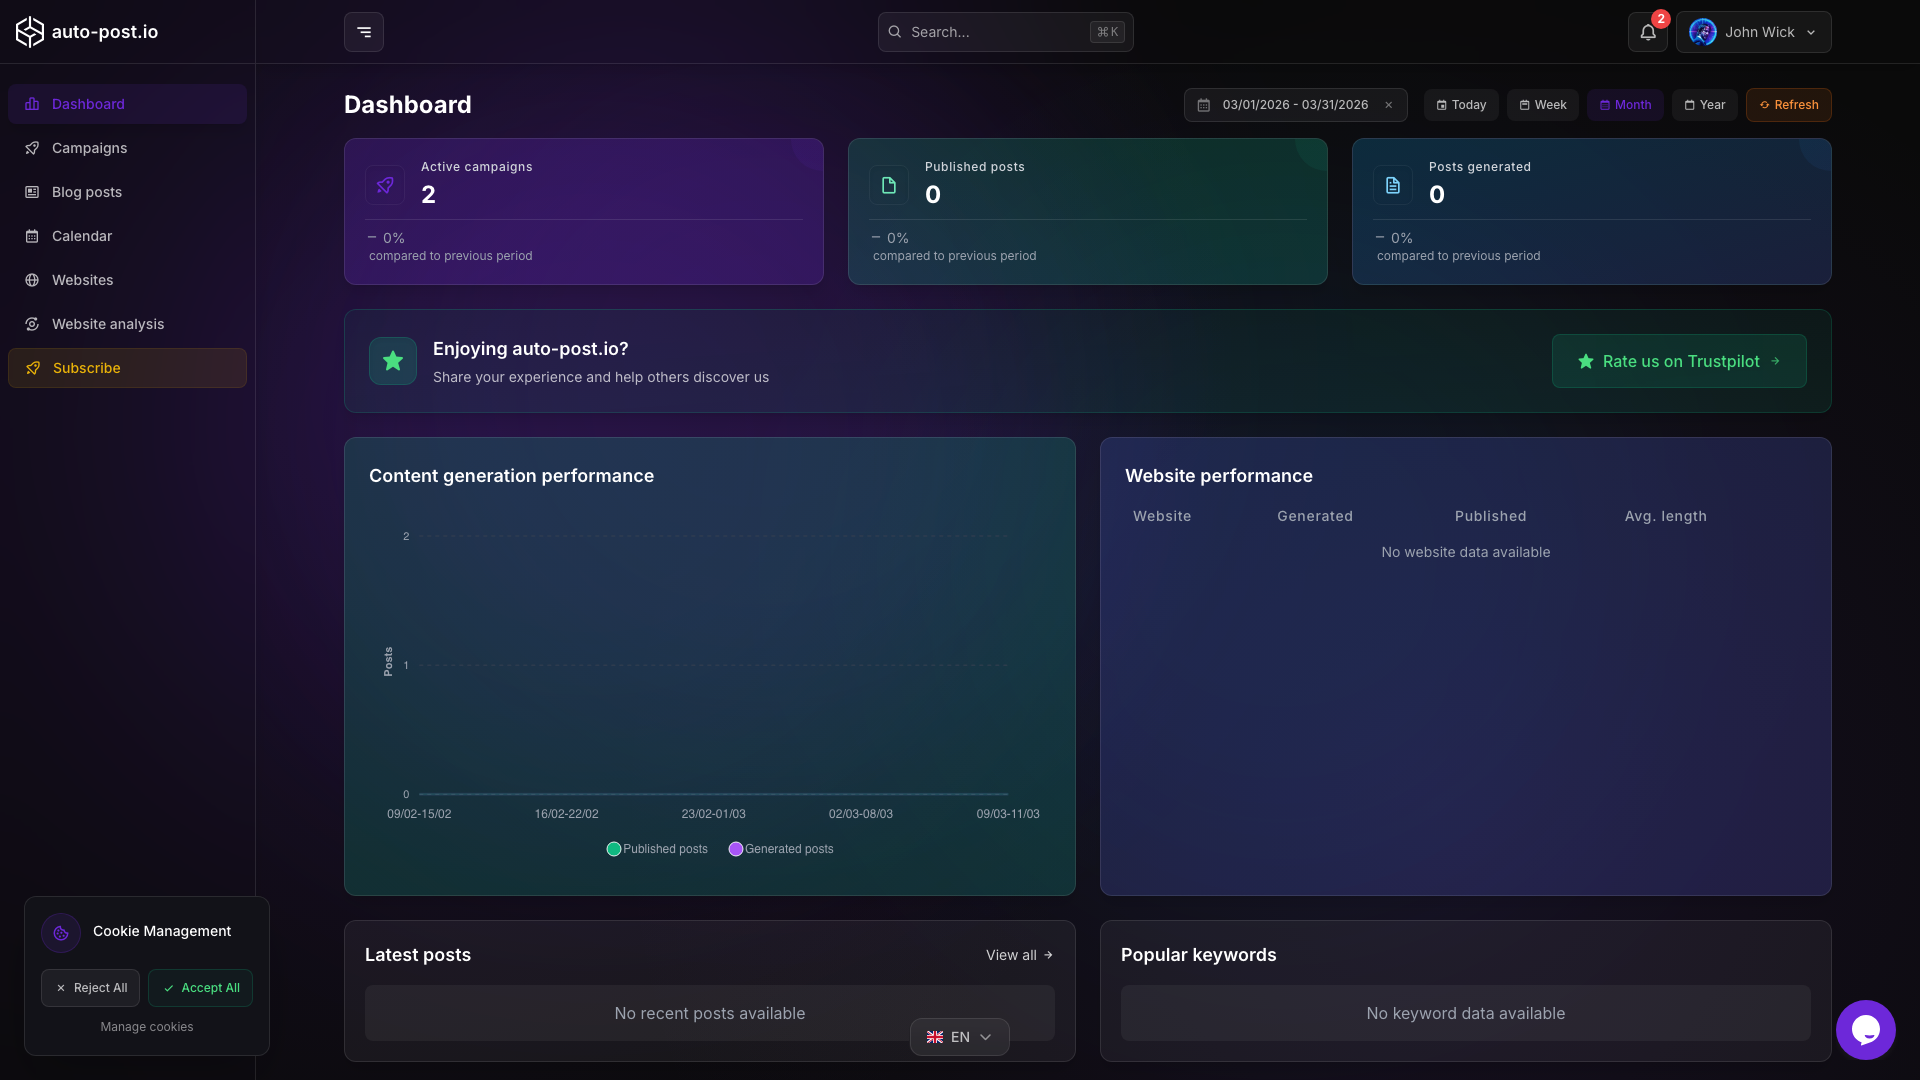
The auto-post.io dashboard is the home page of the app. It summarizes your content activity for a selected period and links to the main tools.
What you see
Period selector
Filter the overview by:
- Today
- Week
- Month
- Year
- Custom date range
Summary cards
For the selected period (or overall totals when no range filter applies), the dashboard shows:
- Active campaigns: campaigns currently enabled
- Published posts: articles published to connected sites
- Total posts: articles created in your account (all statuses)
Activity charts
Charts show generation and publication activity over the selected period:
- Successful generations
- Failed generations
- Published articles
These counts reflect activity inside auto-post.io. They are not traffic, SEO ranking, or engagement reports from your public website.
Quick navigation
From the app you can open:
| Page | URL |
|---|---|
| Blog posts | app/blog_post/ |
| Campaigns | app/campaign/ |
| Calendar | app/calendar/ |
| Websites | app/website/ |
| Website analysis | app/website-analysis/ |
| Billing | app/account/billing |
| Notifications | app/notifications |
Credits
Credit balance and subscription management live under Account billing. For plan details, see Pricing and credits.
Related documentation
TIP
Use the month view first to confirm campaigns are producing articles, then open the calendar to adjust publication dates.
Last updated on 2026-10-04